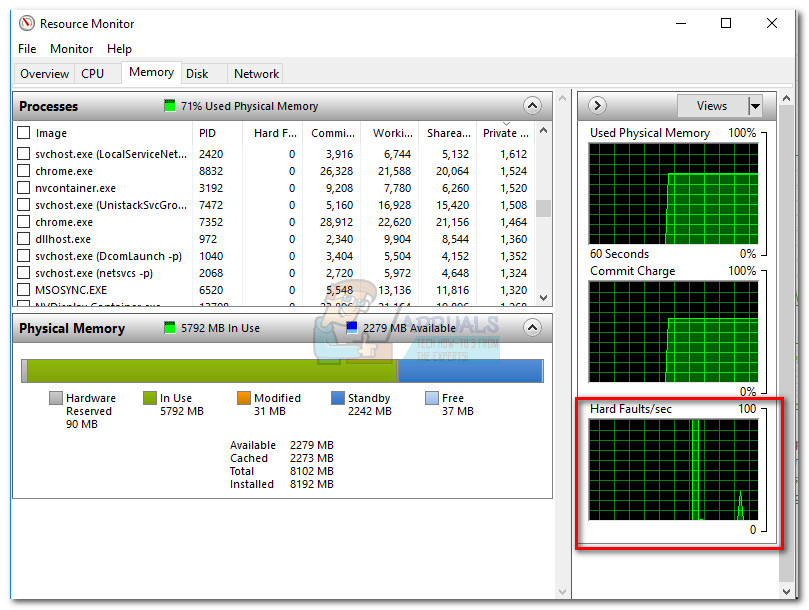
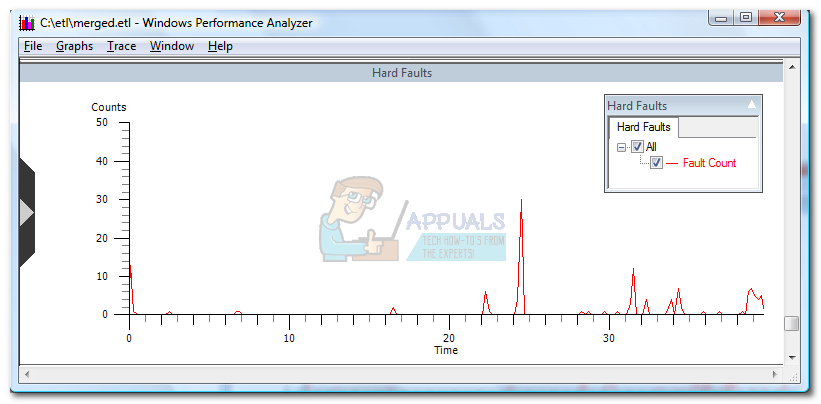
Users usually get alarmed about hard faults after landing inside the Memory tab of the Windows Resource Monitor. Depending on the PC’s specifications and the task at hand, this graph might show dozens, maybe hundreds of hard fault per seconds. This article was written as an informative piece, detailing the technicalities behind a hard fault as well as some tactics related to memory management.
Hard Faults (Page Faults) Explained
Researching about hard faults can turn out to be quite tricky since they were called Page Faults in earlier Windows versions. A lot of web resources are still referring to them as Page Faults – hence the big confusion. Just know that they are all referring to the same thing. However, hard faults (formerly known as page faults) should not be confused with soft page faults – soft page faults happen when a referenced memory page has been moved from one place in memory to another. A hard fault happens when the address memory of a certain program is no longer in the main memory slot but has been instead swapped out to the main paging file. This forces the system to go looking for the missing memory on the hard disk instead of fetching it from the physical memory (RAM). Whenever this happens, your system will suffer certain slowdowns and increased hard disk activity. But the degree in which you’ll end up feeling the effects of a hard fault is highly dependent on the rest of your PC’s components. If the Hard Faults count is constantly high, it usually leads towards a hard disk thrash. You’ll know that your computer is in the middle of a disk thrash when a program stops responding, but the hard drives continue to run at full speed for an extended period. Luckily, since most PCs have more than enough RAM, hard drive thrashing is not as common as it was just years ago. However, it’s certainly not uncommon for a Windows 10 computer with limited resources to exhibit a high number of hard faults per second – especially when too many programs are running at the same time.
How to resolve a high Hard Faults count
If your system is experiencing hundreds of hard faults per second, it’s usually one of two things – either it’s running a certain process that’s hugely hogging the resources or you’re in dire need of a RAM upgrade.
In general, the more RAM you have, the fewer hard faults per second you should see. Some users have reportedly been able to reduce the hard faults per second count by disabling and re-enabling the pagefile.sys file. Windows versions are designed to use a paging file. Sure, you can adjust the size of the paging file, experiment with different configurations or even disable it entirely in an attempt to lower your hard faults count. But there isn’t a better manager for the paging file than the system that uses it. This is why it’s recommended to allow the system to manage it and dinamically allocate as much disk space as needed. Note: Some programs are designed to use the paging file and will not function properly if it’s disabled.
Adding more RAM
If you’re dealing with an excessive count of hard faults, start by checking if your system’s configuration has enough RAM to support the Windows version that is currently installed. Keep in mind that 64-bit version requires almost double the memory needed by a 32-bit version. If you’re below the minimum requirements, the only option is to buy an additional RAM stick or replace your existing RAM with a larger dual-channel kit. Note: Do not be alarmed if you’re experiencing roughly the same hard faults count after adding more RAM – this is perfectly normal and that number will go down gradually. You’re experiencing increased hard faults initially because a lot of programs and processes are being opened for the first time – the system is using processes that haven’t got the chance of having their information stored on the memory (RAM).
Identifying the resource hogger
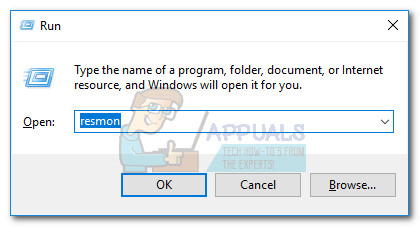
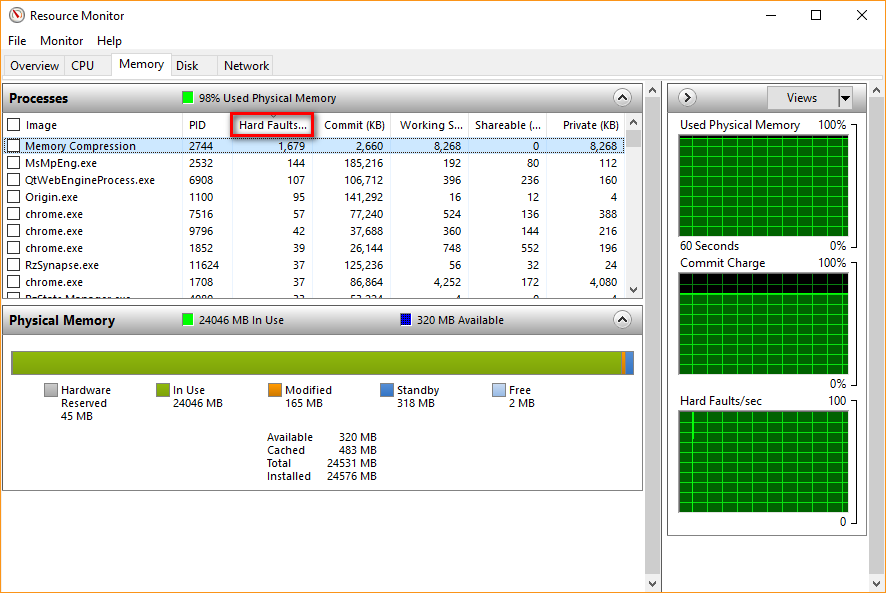
If you’ve determined that you have enough RAM to accommodate your current Windows version, you can probably assume that the increased hard faults count is caused by a certain process that hogs way too much memory. You can easily identify which process is responsible for the hard faults by using Resource Monitor. There are a couple of ways that will get you there, but the easiest way to get there is to open a Run window (Windows key + R), type “resmon” and hit Enter – This will land you right in the Overview tab of Resource Monitor. Once you access Resource Monitor, make your way to the Memory tab and click the Hard Faults column. The first process that shows up first with the most Hard Faults is the one that is slowing down your PC the most.
Note: As seen in the screenshot above -If present, the Memory Compression process should not be disregarded as it’s a memory management technique used by the recent Windows versions. If you determine that one particular process is showing an excessive amount of hard fails per second (over 100) in a consistent matter, you can deal with it in several ways. You can either right-click it and choose End process tree to force close it and all related processes or uninstall the parent application and look for a similar software that is better with memory management.
New Crusader Kings 2 Subscription Service Unlocks Over $300 Worth of DLCs for $5…Halo Infinite Multiplayer Reportedly Using 1GB Of Data Per GameFacebook Oculus Quest 2 VR Headset Latest Edition Leaks With 2K Per Eye Res. 6GB…Elon Musk Announces Verified Twitter Accounts Will Cost $8 Per Month


